ML learned a mapping between env correlates and presence/absence.
MaxEnt
A classical statistical model for fitting presence data to environmental evidence.
A foundational MaxEnt SDM paper: Phillips, Anderson & Schapire (2006).
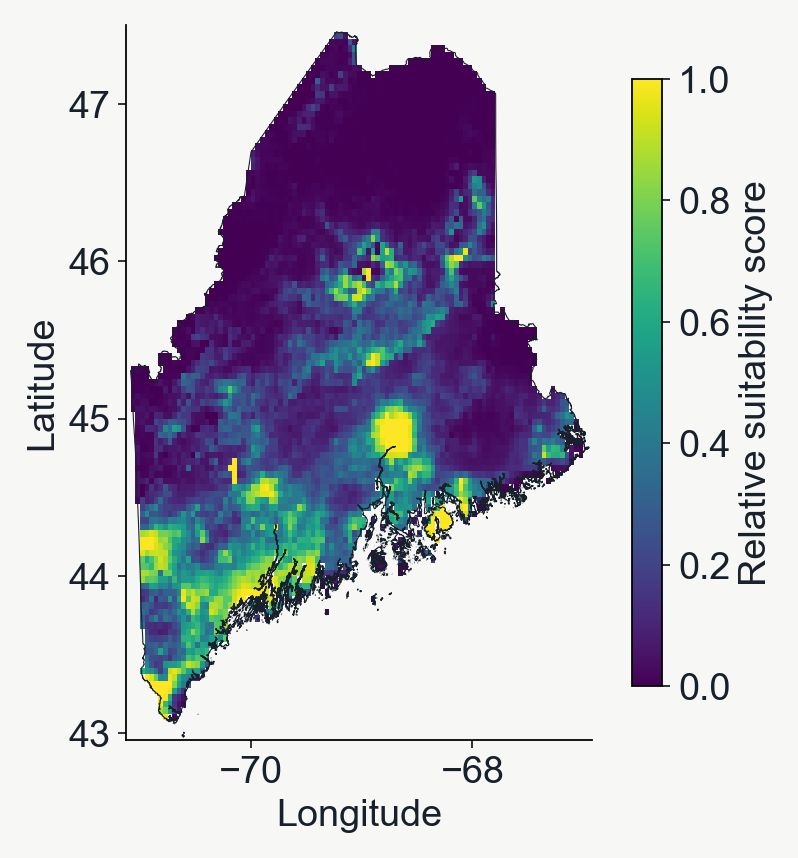
A real MaxEnt fit
MaxEnt prediction projected across the landscape
Just like our previous examples, the fitted MaxEnt model can be used to predict suitability at unobserved locations.
Internally, a penalty discourages unnecessarily complex responses.
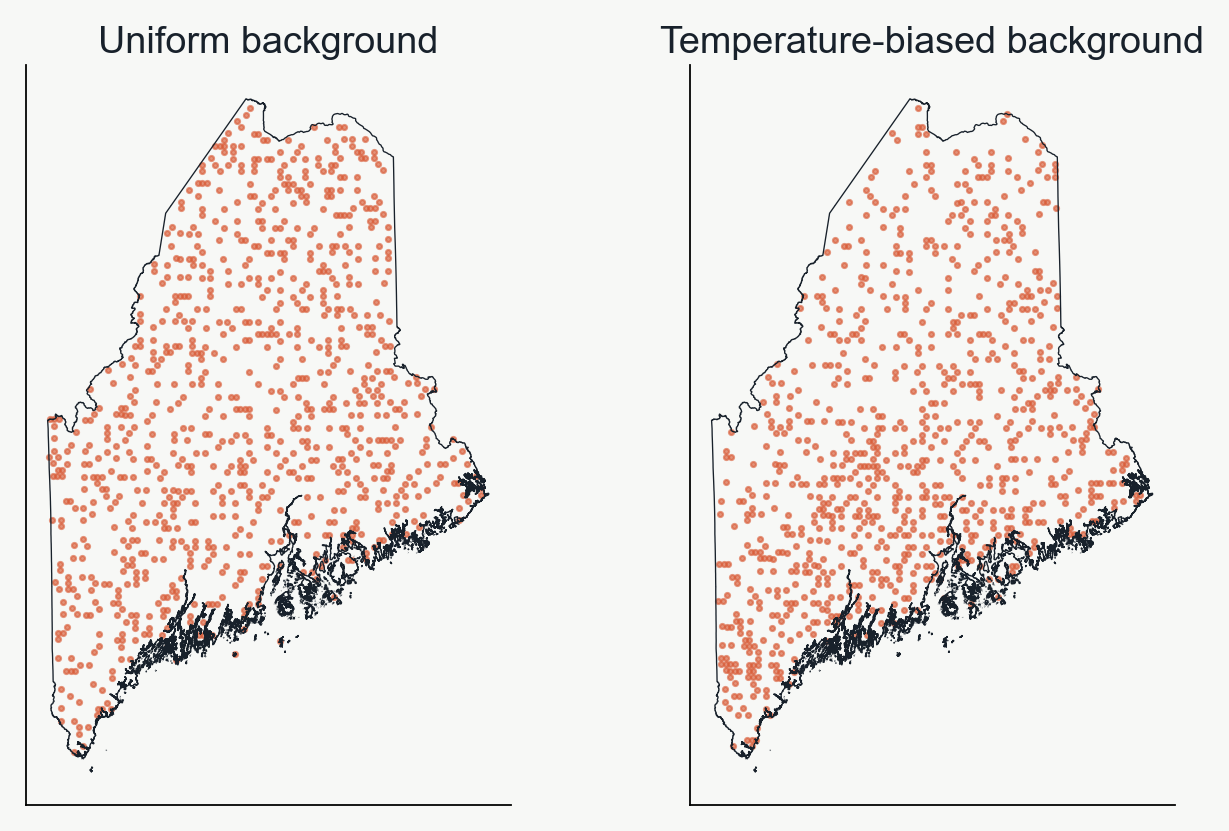
Accounting for observation bias when sampling background points
The background can influence the predictions
Observations will be biased toward where humans usually go (near roads, in parks, where they think the organism will be), so it's important to replicate this bias as much as possible when sampling background points.
In the lab we will take mean annual temperature as a proxy for sampling bias, but in practice you might do something fancier.
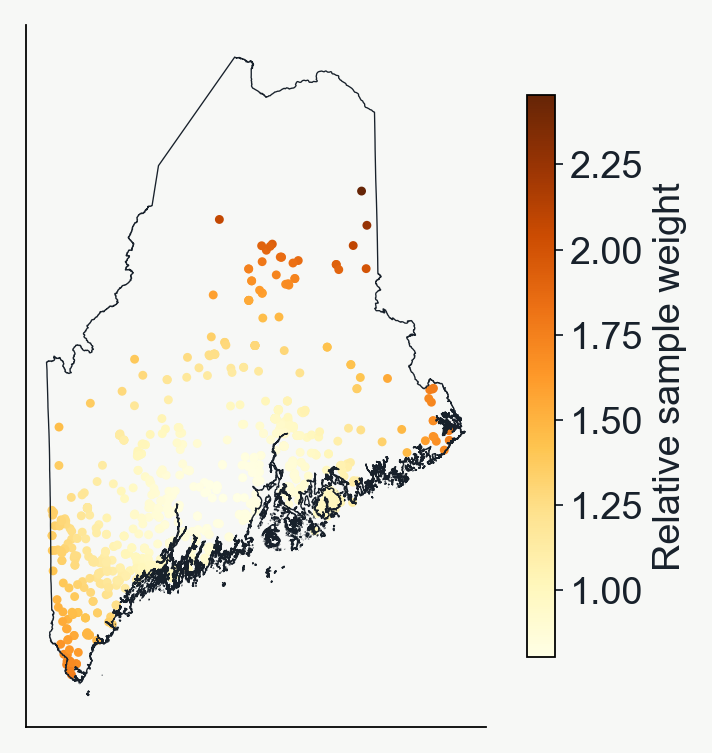
Geographic sample weights
Sample weights change a point’s influence
Many neighboring observations can repeat similar information.
Distance-based weights give relatively isolated records more influence.
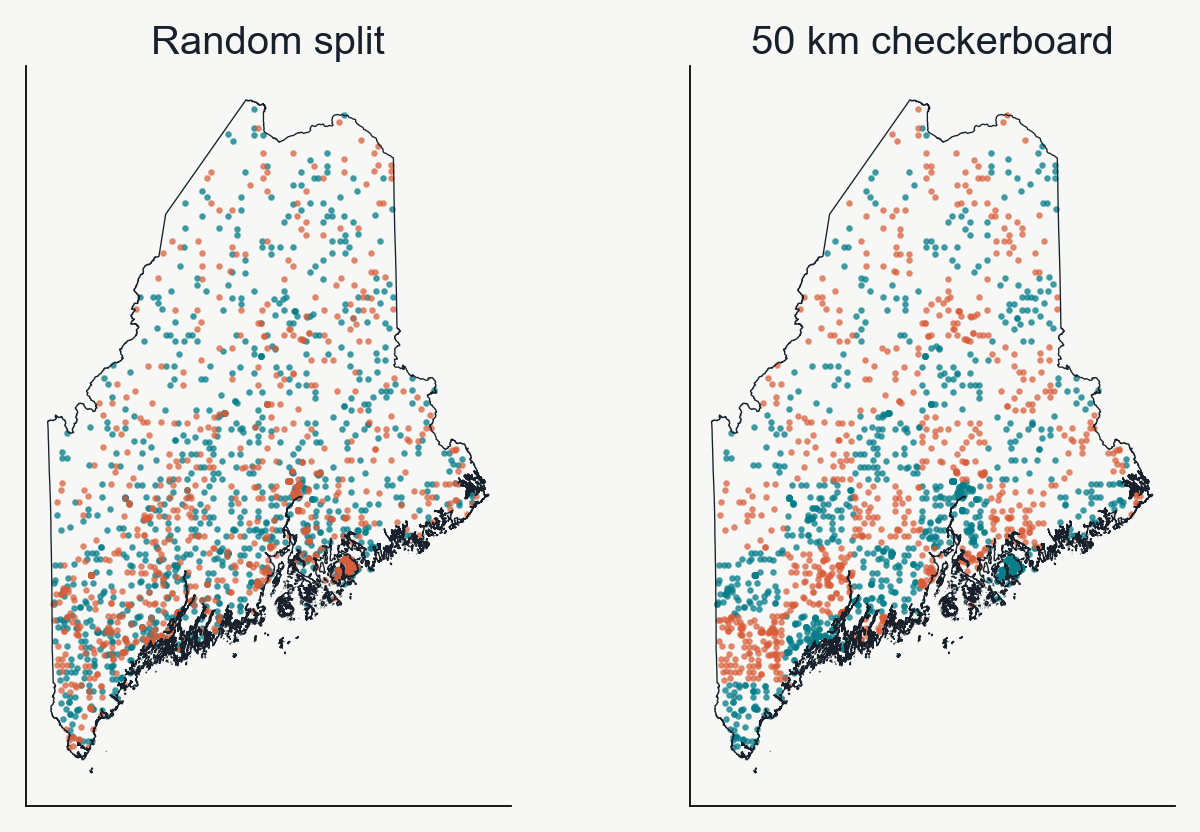
Geographically aware splitting
Geographic splits withhold whole blocks
Keep an entire square in training or testing.
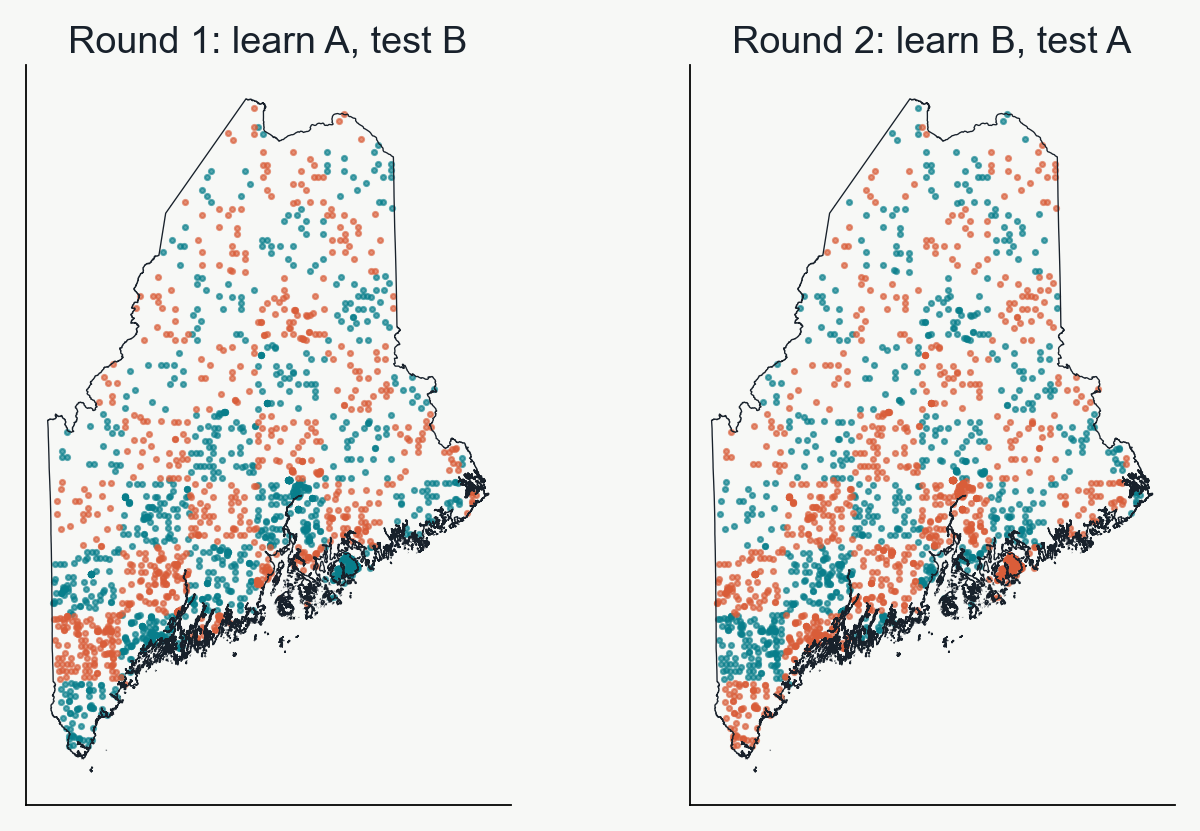
Lab08 uses alternating 50 km squares.
Teal training set. Coral test set. Nearby locations often share climate and sampling history.
Evaluating robustness of test/train splits
Cross-validation rotates the test group
Presence/background points are split into 'K-fold' groups, and each group takes a turn as the withheld data. A new model is fit to each 'fold' of the data, and performance is evaluated as the average across N-folds.
Group A
Group B
Group C
Round 1
Test
Train
Train
Round 2
Train
Test
Train
Round 3
Train
Train
Test
A group is often called a “fold.”
Two-fold spatial cross-validation
The checkerboard groups can swap roles
Each model predicts the group of locations it did not use for learning.
Leave-one-out (LOO) cross-validation is the logical extreme of k-fold
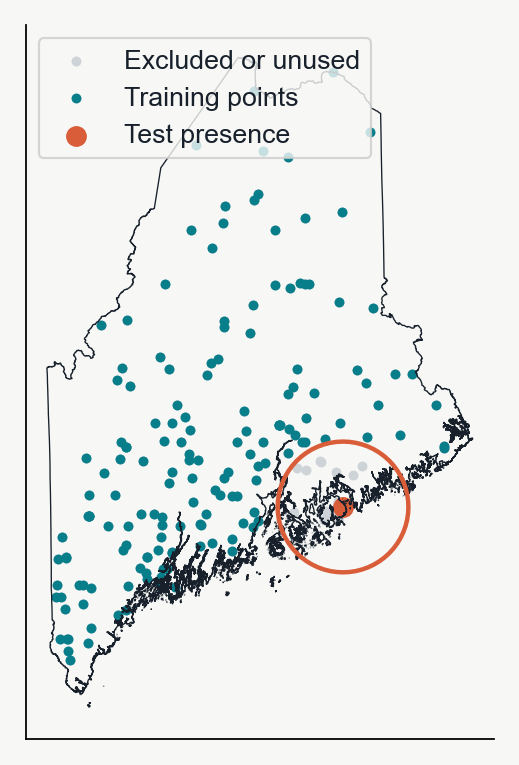
Buffered LOO controls for spatial auto-correlation
Hold out one observation as the test data.
Remove training points within 50 km.
Fit the SDM to all the remaining points.
Evaluate prediction accuracy for the one held-out point.
Repeat for another observation.
Evaluating the frog model
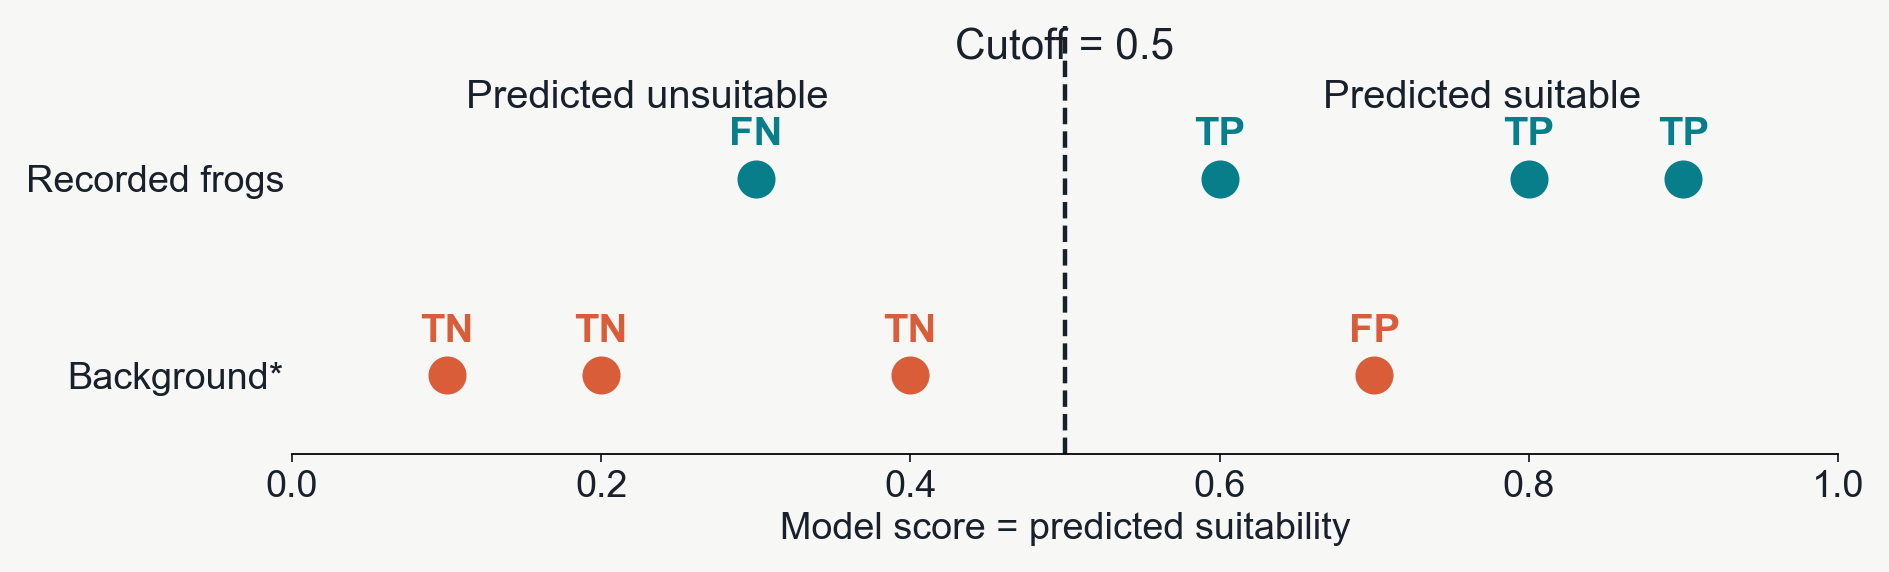
Which sites does the model call suitable?
True positives (TP): recorded frogs predicted suitable — 3 of 4. False positives (FP): background sites predicted suitable — 1 of 4.
*For presence/background AUC, background serves as the “negative” class. These are not confirmed absences.
Comparing models across all cutoffs
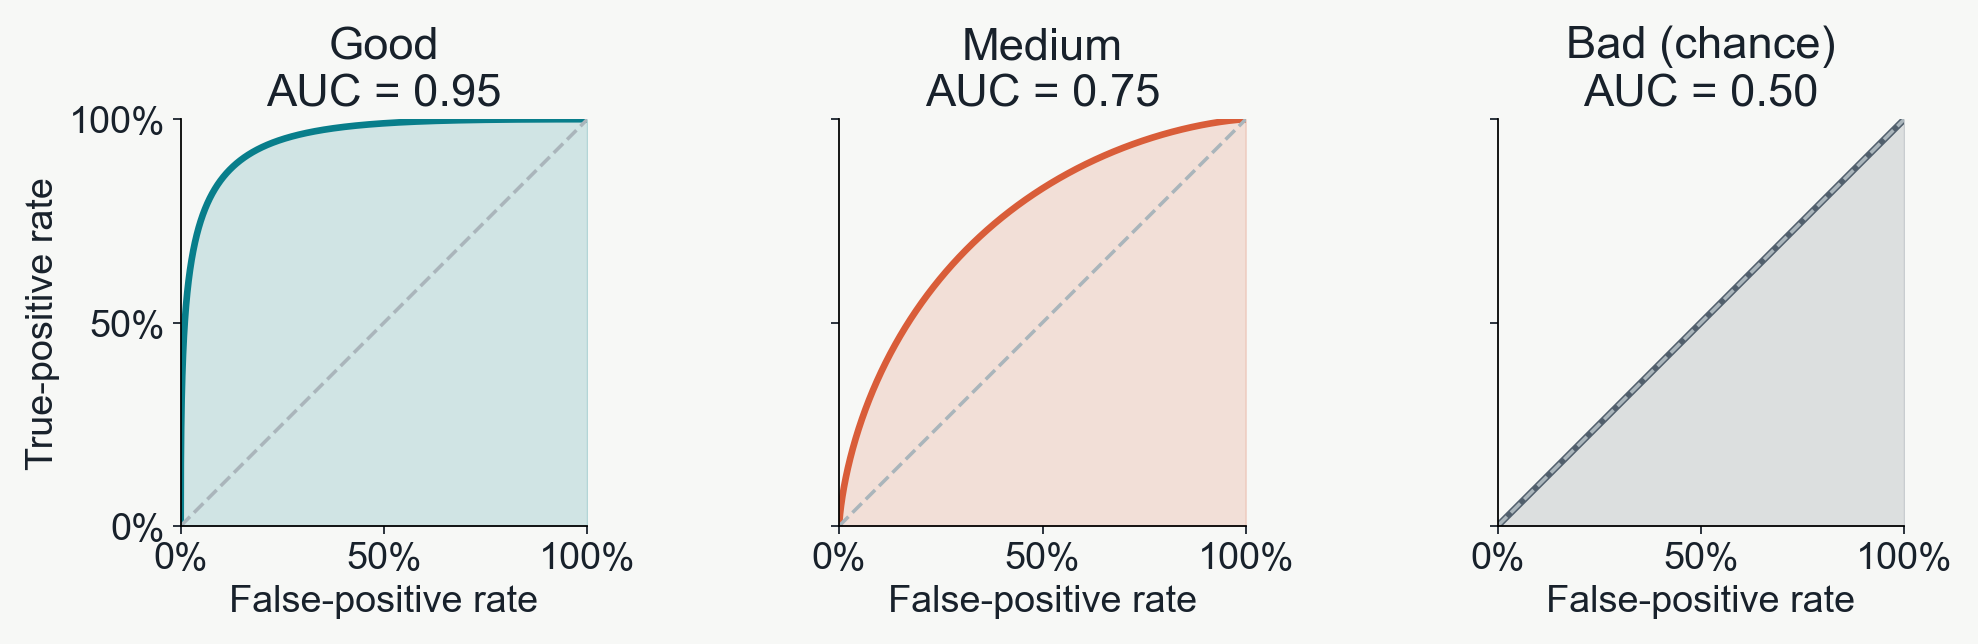
Good predictions find frogs with fewer false alarms
Moving the cutoff traces each ROC curve. Toward the upper left: more true positives, fewer false positives.
AUC = area under the curve. Larger areas mean better separation of recorded frogs from background.
Illustrative curves, not fitted results. “Good,” “medium” and “bad” describe these examples, not universal AUC thresholds.
High AUC isn't always 'better'
Spatially/environmentally informed splits can improve model generalizability
Evaluate using
AUC
What is the model predicting?
Training records
0.875
Locations it already learned from
A random test split
0.798
Held-out points, often near training points
A spatial test split
0.664
Entire withheld geographic blocks
A higher random-test AUC can reflect an easier test, rather than better prediction in new areas.
Nearby points share climate and local patterns. Spatial splits reduce this overlap and help expose overfitting to those patterns.