
Eco-evolutionary Simulations
Biodiversity is structured hierarchically across spatial, temporal, and taxonomic scales. It is therefore important to integrate across multiple axes of biodiversity data when constructing models and performing inference. My core research interest is to investigate the feedbacks among axes of biodiversity data that accumulate across these different scales. I primarily develop individual-based, mechanistic models, and apply statistical analysis with a focus on emerging machine learning methods.
Take this example of real data from a community of spiders from La Reunion.
On the left is a typical species abundance distribution (SAD) and on the right
is the species genetic diversity distribution (SGD) which is constructed in an
identical fashion, gathering COI data at the community-scale, calculating
nucleotide diversity (pi) and ordering pi from greatest to least:
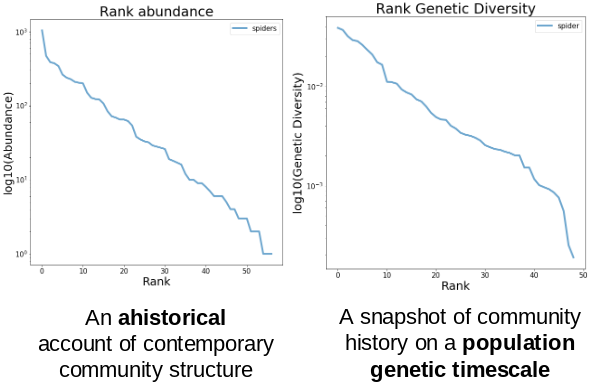
The core insight here is that the SAD and SGD record the history of the community on different timescales! My modeling approach seeks to simultaneously exploit the information from both of these axes of data, and to extend this synthesis to include phylogenetic information as well!
gimmeSAD: A joint neutral model of community abundance and genetic diversity
As a first approximation, collaborators and I developed a joint model of abundance and genetic diversity in ecological communities. This model is called gimmeSAD and it is published in Journal of Biogeography
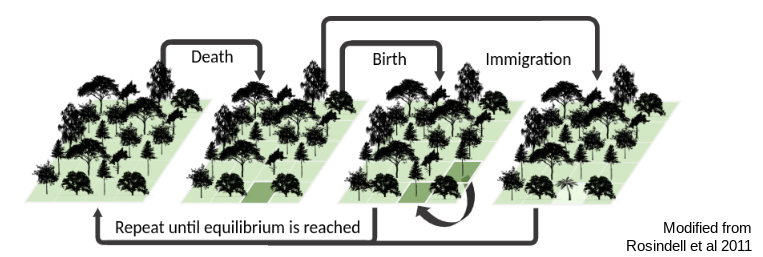
This is an individual based model inspired by Hubbell’s neutral theory (following Rosindell and Harmon 2013) in which we model a local community of fixed size undergoing a birth/death/colonization process. A simple figure shows the basic idea:
This community assembly process is linked to a backward-time coalescent process in order to generate genetic variation per species, conditioned on the abundance and colonization history of each species in the forward-time process. The results of a typical simulation generate linked patterns of genetic diversity and abunance which can be visualized:
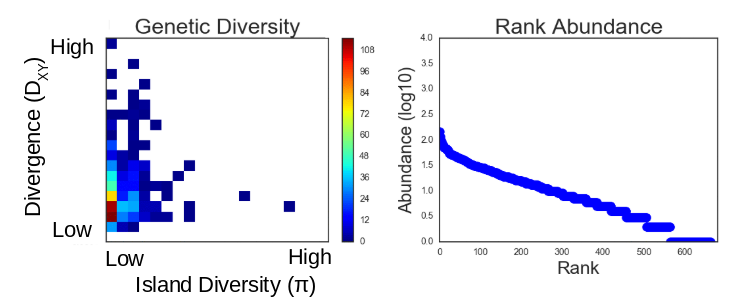
The right panel here shows a typical SAD generated from a simulation and the left panel shows the 2D distribution of genetic variation within the local community (pi) and genetic divergence between the local and the metacommunity sister species (Dxy).
We can generate numerous simulations using this model and use an approximate Bayesian computation (ABC) inference procedure to estimate parameters given observed data from real communities (for example from the spider community data shown above).
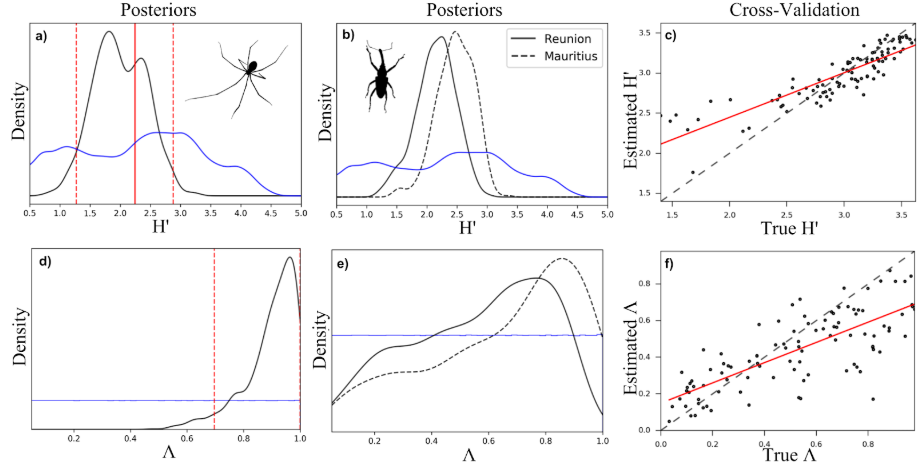
In this figure H’ is the Shannon entropy (a measure of community richness and evenness) and lambda is a measure of how close the community is to equilibrium. Panels a) and d) show ABC posterior estimates of H’ and lambda for the spider community and panels b) and e) show posterior estimates for two weevil communities. Panels c) and f) depict ABC cross-validation for each of these parameters, essentially indicating the ability of the ABC procedure to estimate parameters from simulations generated using known parameter values.
MESS: Massive Eco-evolutionary Synthesis Simulations
Collaborators and I have more recently embarked on an effort to increase the power of the gimmeSAD model by introducing non-neutral community assembly processes (e.g. competition and environmental filtering) and by including a speciation process in the local community. We call this new formulation the MESS model. For example, we have implemented non-neutral dynamics by giving species trait values and borrowing mechanics from classic co-existence theory:
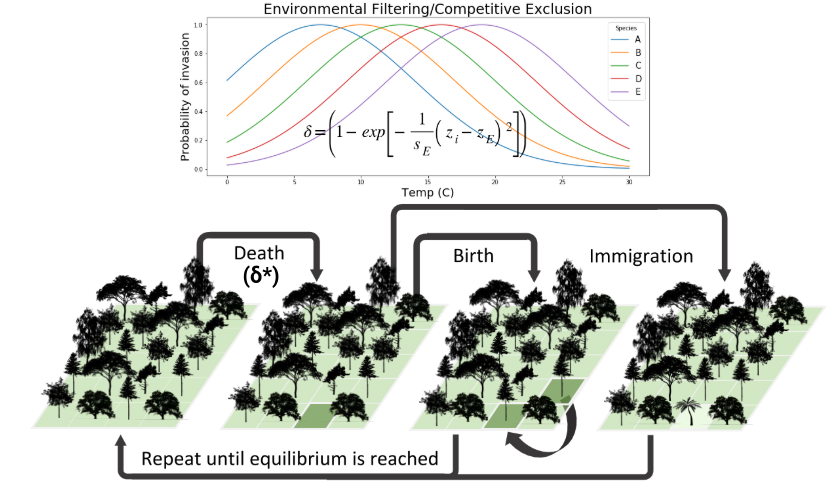
In the neutral case individuals of different species are ecologically equivalent, so the probability of being removed is independent of species identity, and is equal for all individuals in the community. With non-neutral dynamics we allow individuals to have differential probability of death based on their trait values and either a competition or an environmental filtering model. Several promising avenues of research are available here to improve the non-neutral dynamics of the model.
MESS model simulations can be used to not only estimate key ecological and evolutionary parameters but also to classify community assembly models using observed community-scale data.
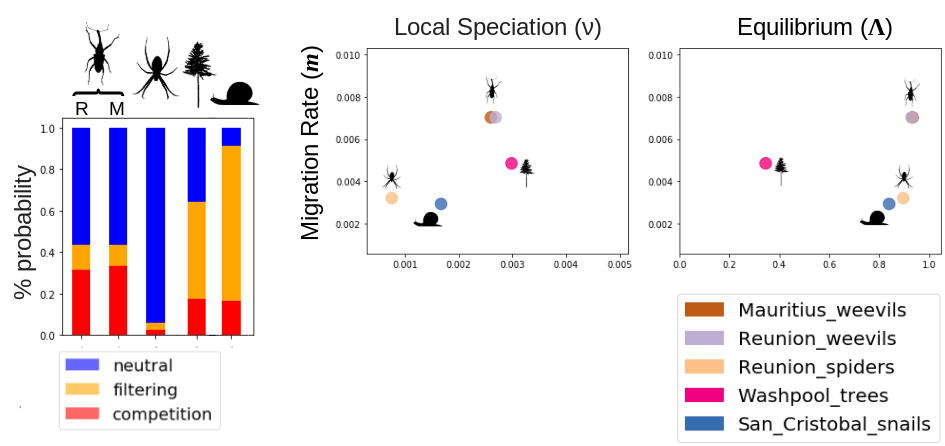
This figure depicts community assembly model classification for several different communities of spiders, weevils, trees, and snails, as well as a snapshot of some of the parameter estimates.
MESS provides a powerful framework that empirical biologists can use to investigate ecological and evolutionary processes which have contributed to the structuring of the communities which are observed in nature.